| Online Search and Search Advertising (2010-2012) |
|
In April 2010, I joined Microsoft Corporation
as Group Product Manager. The title was misleading, though it did include business and product management components in search monetization. It was a hybrid role that also included a lot of applied research. A more accurate title of the role I really performed would be Principal or Chief Scientist (regardless of the trappings of power of the title): finding opportunities and translating them to enhance the product and overall quality of monetization through sales channels, messaging and of course, features.
Note: this page becomes increasingly sophisticated ; please scroll down for a more quantitative discussion |
| Strategy, Planning, Alignment: Playbooks |
|
From the beginning, I was closely involved with the integration of Yahoo! Paid Search and Panama platform with adCenter (now Bing) platform, the largest migration of its kind with combined annual revenue of about US $2.5BB. I was the Microsoft lead for writing and implementing marketplace, advertiser and publisher playbooks. These docuemnts detailed the endgame and a comprehensive structure for dealing with all potential eventualities in a seamless way. We also had dozens of what-if scenarios with various severity levels, how to identify them and how to resolve them. What gave me greater satisfaction still was the fact that we were able to implement the playbook, which is relatively rare, as I learned later. The migration has now been adjudged to be a success, and some observers have even been surprised at how smooth it seemed to have gone. Though earlier in 2011, statements by Carol Bartz stated that not all was well. I remember the Command Centers I ran for several months during the beta-testing phases. While the general idea of Search engines is very simple, there is immense complexity in implementation and checks and balances through policy, diktat, legal reasons or (deliberate or serendipitous) backdoors. Reporting official numbes and comparisons every day and triaging all sorts of issues was like Baptism with fire. On the plus side, it gave me an excellent end-to-end perspective of online business and monetization. |
| Reporting and monitoring big data |
|
Reporting and insight generation from big data has its own challenges. At the rate of 100 million searches a day and a lot of content and action on each page, at least potentially so, memory needs to be guarded carefully when processing and distilling the metrics and floating point math needs to be handled carefully. Consider the case where 0.415 is rounded to .42 and 0.414 to 0.41. If that is the cost per click, prima facie a difference of 1 cent for 100 million search pages translates to $1MM, which is substantial. If a dashboard contains many such metrics, rounding off here and there when copying numbers in Excel can break the symmetry of related metrics and cause a lot of confusion for a lot of persons -- let's face it, a lot of analytically minded persons are known to do some mental arithmetic. All of this sounds very similar to the basic precautions we all learn in Physics 101, to compute the error bounds; yet, purportedly there is no confusion about the cost per click because that is how an advertiser is billed. Getting the concept of measurement error understood is not trivial, as the preceding discussion shows. Now on to non-technical discussion. Not surprisingly, conflict over what the data really means is old as time itself; just read a history of the Peloponnesian wars: one of the earliest recorded (for the most part) fact-based histories. Reports on big data ages very quickly. Perforce, the early metrics are simple to compute (to provide some cushion for computation and data pipeline delay) and simple to explain and raise more questions than they answer. The other danger is of addiction to a stream of data that will have some patterns, as it must. Since there is a lot of data, there is opportunity for everyone to find gold mines. With the welter of data, the less analytical, busier or old school executives just give up and go with their gut feelings. That further complicates matters by encouraging others to discredit the data and reports via technical points. Getting the executives hooked on the semblance of activity and movement is a real danger, which precludes further progress and traction for deeper insights. One cannot be cautioned strongly enough against this eventuality, which brings to mind lines from the Led Zeppelin classic: Kashmir. |
|
Talk and song from tongues of lilting grace, whose sounds caress my ear |
| Intent Matching, Natural Language Processing and Socratic Reasoning |
On surface, the paid search business model is simple: show relevant paid search results based on user intent and make money. Of course, the system is immensely complex and it is far from a solved problem, with some of the best minds working on matching demand and supply optimally. The Scientist in me felt delighted with the sheer wealth of measured data, and challenged by the seemingly contradictory interpretations of the same number or metric. The beauty of online business is that the barrier to entry is very low as we are all consumers of digital media and engage in myriad ways every day with search engines, online marketplaces, news sites and more.
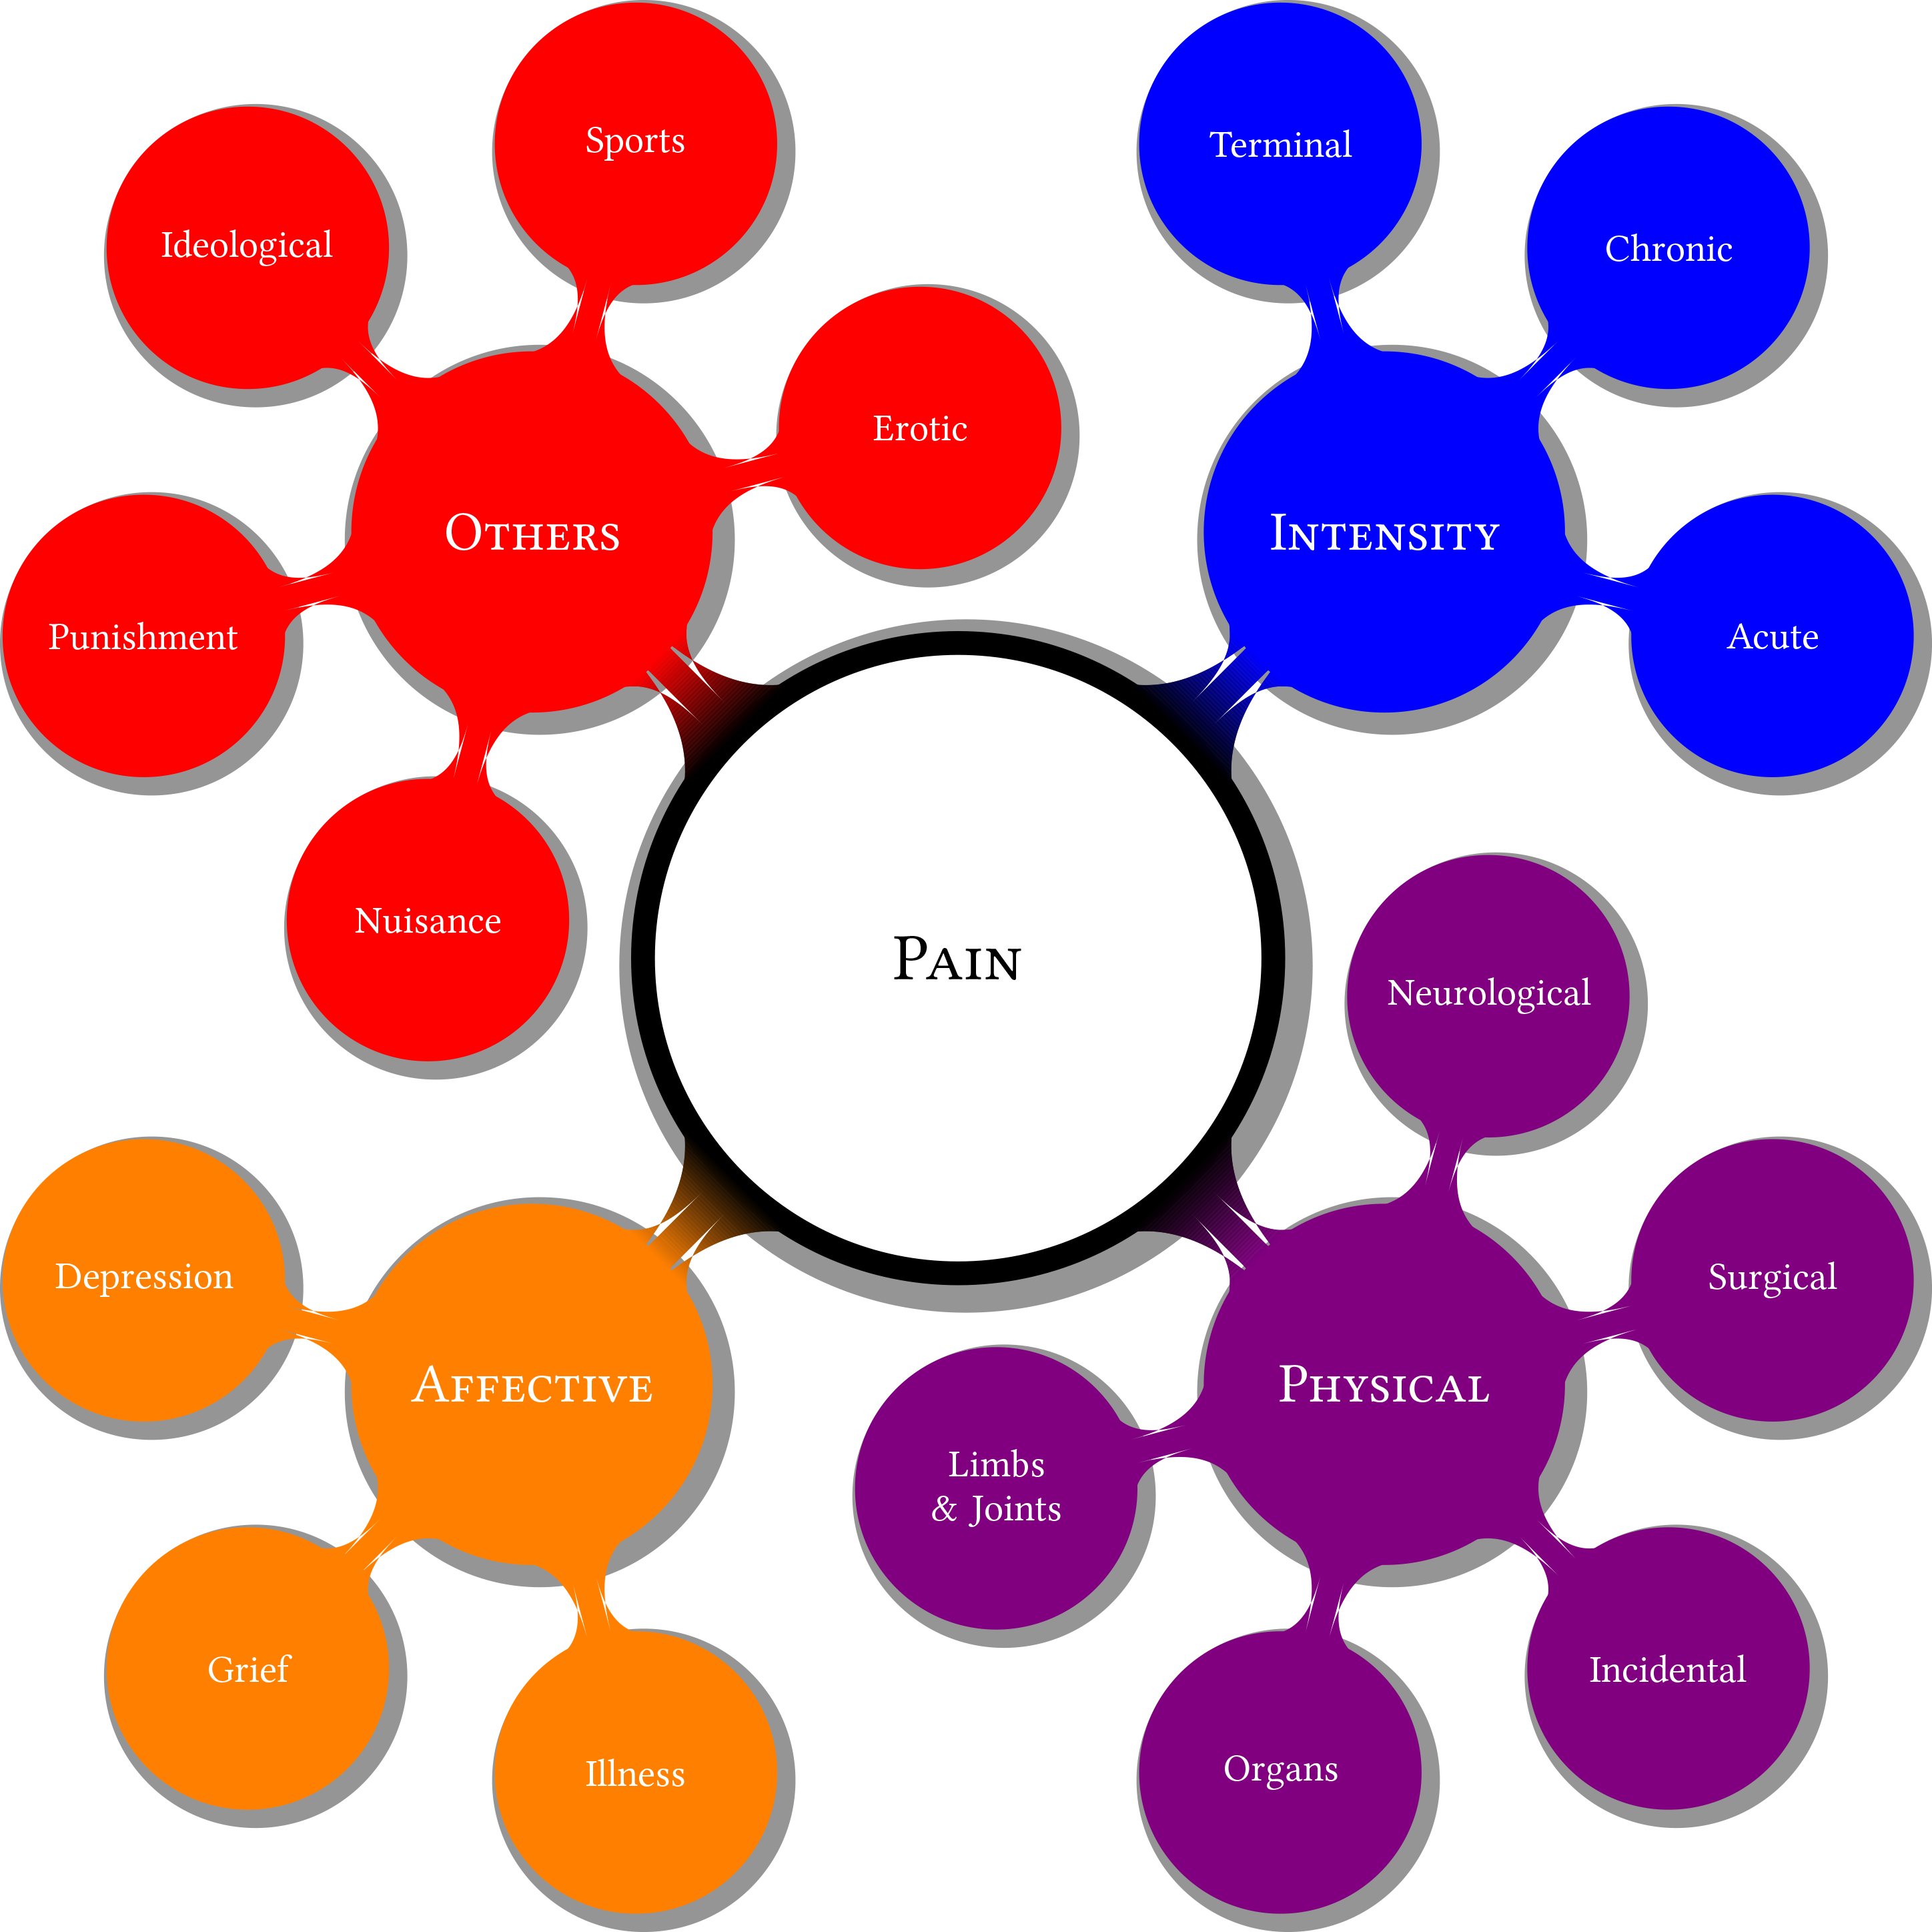
Soon one gets into Socratic method: just what exactly is relevance? Does the search user himself/herself know what specific information was being sought: that sounds a lot like Epistemology. If a user searches for heart, are they looking for the Classic Rock Band Heart which some call the only true Led Zeppelin tribute band, Human heart, heart as an organ, or as in a noun or verb? This is the simplest example of the maddening vagueness in short text strings. Although it can be addressed by a dictionary or thesaurii-based disambiguation appproach, that is not enough because all reference material lags behind the current patterns of language usage. This is precisely what makes solving Crossword puzzles in English so enjoyable. The graphic on the left illustrates this approach for the word Pain without any context. The reference could be to the intensity of pain, or to the physical source of pain; pain could be like suffering and affective, as related to feeling or affect. Aside from these three themes, pain could relate to other dimensions such as ideology. With a large text-corpus, the n-gram approach works well with some secret sauce and treating words as units of information. However, for very short strings, that approach does not work well and many times works very poorly. Click for full image. These are standard problems with Natural Language Processing: however, the context in search advertising is excruciatingly tiny and tagging or labeling itself is not fully concordant. Assuming that the tagging is provided by humans (which is the case for Google and Bing), it is the reality on which all models are trained. When scraping a large corpus of text, co-occurrence can occur with absolutely no thematic relationship or with an opposite thematic relationship than what the model learned on. Towards the end of April 2012, there were many searches on Ryan Seacrest, host of the American Idol show. There are often a lot of searches about the US presidents, and April 2012 was no exception. What if, by pure chance, in April 2012 there are more searches about Barack Obama? Careless algorithms would overfit and learn that Ryan Seacrest and Barack Obama are thematically related! However, other than a shared species, the author does not see other similarities. Not understanding entities is a serious flaw in any text-related algorithm. Advanced Discussion Despite tones of deconstruction, it is an eminently practical problem to which a solution is needed; and in fact billions of humans every day are able to get an accurate enough idea of what the other speaker wants or the fact that the interperter in question does not know what the other speaker wants. |
| Advertiser Demand |

Direct Marketing or Advertising only needs address two questions. First, what does the customer want; second, what does the seller want? When an intermediary is introduced, be it an ad agency or the search engine matching platform the interests of that party need to be considered. Of course, the third parties or intermediaries have costs to maintain, process and review performance of ads and need to find ways to turn a profit themselves, while ensuring both the advertiser and the search user derives sufficient utility in the sense of Economics to consider returning. Since the number of slots available is far smaller than the putative demand, this is nowhere as simple as an optimal assignment. Operating the marketplace to everyone's satisfaction is a difficult task. There's a nice graphic that illustrates this point quite well through the use of ternary diagrams or simplex plots used in Game theory. A thumbnail is shown to the left. In a zero-sum game, where the sum of utilities for user, advertiser and the network (third party) is fixed, the state of the marketplace can be shown via barycentric diagrams. Bluish area depicts the situations where the advertiser is favored to the exclusion of everything else. Let's consider the final objectives of advertising on search result pages. In general, a higher bid pushes their ad higher up and would probably cost more per click. Suppose the advertiser knows their margins and returns on investment (RoI), many possibilities exist. The advertiser strategy might be to dominate, optimize for share of eyes, precision targeting by time of day, gender and any other means, generating brand awareness or something different. Things get messy very quickly as stochastic shocks abound and every day is a little special in its own way. |
| Advertiser Strategy and Hidden Markov Models |

We modeled advertiser strategy, or rather imputed it, using Hidden Markov Model. Why HMM? They're simple, easy to explain and can be expanded as we insert layers and retrain the model in an incremental fashion. That is very important as one gathers support for predictive modeling and scientific approaches in a business setting. Some explanation is in order. Let's stay with the metaphor of online advertising, though the approach is fully applicable to any advertising or optimization that involves agents (whether human or not). An advertiser has a strategy in mind when beginning advertising. Whether to get more customers in store, or to increase online leads and conversions, or gaining prominent spots for prospective customers. The strategy itself might not be known to the advertiser! An advertiser enters the graph from left. With some unknown probabilities of behaviors shown by B1 through B4 that are themselves observable. The behavior then leads to campaigns, denoted by prefix C. One expects that the arrows from B to C layers would have probabilistic basis. From the expressed demand via campaigns (keywords, bids, targeting etc.), the matching platform comes into play. Some keywords might never be matched for the simple reason that no one searched for them. That is shown by the node ∅ in the P layer. Of course that subset will get no impressions on a search page, as shown by the node ∅ in the O layer. From platform, one moves to the O layer that concerns itself with ads that were shown to a user, and finally to the F layer standing for clicks. We can begin to train the model starting from left and then relate advertiser strategy to their behavior and campaign setup. The graphic was made using the wonderful LaTeX package TikZ, supported by Till Tantau who is owed sincere thanks by me and many other scientists. |
| Alignment of Demand and Supply |

The figure to the left depicts the various tropes in advertising through an intermediary. If we let red stand for user interest, intent or utility; blue for advertiser intent and yellow for the quality or relevance of the resultant. The 0/1 combinations of these three entries can be shown on a color wheel. The intensity can be shown by the distance from center. If demand and supply (advertiser and user intents respectively) are present in good amount, but quality (a measure of engagement and utility, that can be summarized by a combination of user dwell time on the landing page for online search) lacks, that is represented by the orange color. In that case, of course, the simple action is to acquire advertising budget. If one finds that user intent is high, but the demand lacks quality (as explained above) as well as budgets, the problem is not having the advertiser that can provide both quality and budgets: this is an uptapped market since the user intent is keen. This is shown by the magenta color. As the third example, consider when the user intent is not there but the advertiser intent and quality are high. This is a mismatch where the advertisers are unaware that the users are not interested in their wares, perhaps for a time window. The best solution is to show fewer ads and enhance the user experience. This is represented by the green. Of course, when all three factors are high, everything is perfect and we'd obtain the harmonious white color. If all three factors are low, we tend towards black, the color of total darkness, standing for a market that does not really exist as a worthwhile market. We can use a fourth dimension for the intensity, but here we will use the inner circle for perfect alignment. Obviously this approach can be applied to rectangles and pentagons with little effort. It is reasonable to expect the the alignment of demand and supply would change during the day as the user intent varies through the course of a day or other temporal factors such as weekend/weekday or national holidays. The same is also true of advertiser intent as that depends on the budget and expected sales. The diurnal pattern can be shown as a curve in the colored region, which is reminiscent of a random walk on a torus! Assume the user intent has a clear peak. When user intent is low, the curve might be in the green region, and move to the center (white) as user intent begins to increase. When the user intent declines, the curve might move to the orange region if the quality holds but the price support does not. This opens the doors to monitoring the search marketplace in an elegant and simple fashion. |
| Experimentation and A-B Testing |
")
Online Experimenation and A-B testing is critical and fundamental to innovating online. Over time, much knowledge has been gained, but of course, things change all the time and more learnings come our way, showing us how many things really we don't understand. Anyone who has depended on the response of biological organisms for completing their thesis knows how maddening and fickle the mice or any lifeform can be. That after you run experiments every 8 hours for 10 months before realizing the line of questioning was mistaken or flawed in a major way. That's a huge contrast from switches, electronic units and other inanimate automatons (who still don't exhibit massive complexity by random design). The figure at left shows the difference between the standard normal distribution(solid line) and a Student's t-distribution with 2 degrees of freedom (dotted line). Without getting into the details of hypothesis testing, let's assume that the t-Statistic is -2. If we assume normal distribution, the corresponding p-value is 0.02275, meaning the chances of obersving this value (or smaller) our of pure luck is 2.275%. Even in a two-sided test, the p-value would be 4.550% and less than the mythical 5% significance level. Textbook application would then reject the null hypothesis of no difference between test and control. Not so fast, my friend! (Whoa, Nelly!) The bottom subplot shows the cumulatives, and a good 10% measurements are lower than -2 by pure luck alone. If the null distribution is described by a t-distribution with 2 degrees of freedom, we cannot reject the null hypothesis. This is a huge difference. My work has shown, as has the work of many other Physicists. I highly recommend Johannes Voit's emintently readable book The Statistical Mechanics of Financial Markets, which shows that in many cases a t-distribution with 2-2.5 degrees of freedom or a Lévy alpha-stable distribution with α=1.4-1.6 describes the stock market and even supermarkets quite well. I've written a research paper critiquing Online Experimentation that showed how standard classical statisical methods cannot be applied to online experimentation with modification, for several reasons. I am working to prepare that paper for publication in a journal. The gist of the matter is that online experimentation is more like economics and stock market, than differently brewed Guiness beers. I show that in a string of highly commoditized and even desultory activities, memory is brief and therefore the fundamental assumptions of hypothesis testing in the Neyman-Pearson tradition is not sound. We then proceed to suggest several practical alternatives that are simple and robust. |
| Nash Equilibrium, Information Theory and Auction Scale |
|
Many online businesses are predicated on the potential of achieving scale, a mythical state of being where the good just multiplies :) Attend any presentation to a venture capitalist and you're more likely than not to hear the word scale: how many users, how many returning users, how many unique users? From an engineering point of view, scale is fairly easy to understand and address (assuming money is no concern). However, how exactly does the combined auction marketplace achieve scale? Matters are further complicated by the time delay between making a move and observing its impact on equilibrium. There is no guarantee, furthermore, that the Nash Equilibrium we obtain for successive moves (allowing time for the true impact to appear and stabilize), would themselves not be unstable. Particularly for paid search with only two major players and the larger player still growing its share, non-stationary, non-equilibrium macroeconomics is my guess. But how non-stationary exactly? That's an open question. Even the matter of measuring the level of scale or competition is rather wide open. One relatively analogy that comes to mind is of chemical reactor design with 3 equilibria: of which the middle one is unstable and the rest stable. That is the case in a deterministic setting. It remains to be seen if there exist attractor in such game-theoretic framework and whether they have saddle points or not. In our recent research, we have shown how auction scale, reliability engineering, entropy measures all come together to allow a metric for measuring the scale in auctions. We then releate the hyper-parameter in our metric to Symmetric Nash Equilibrium. |
| Summary |
| My work in this field has been quite wide-ranging, which I gather can be confusing and/or maddening to a gentle reader. If you are interested in my work, you may contact me here |


| (c) Copyright 2013 Sandeep Rajput. All Rights Reserved. |